Morphometrics: Introduction to the Analysis of Shape
Morphometrics: An Introduction to the Analysis of Shape
Course Context: GEOL 331/BSCI 333: Morphometrics, Functional Morphology & Biomechanics | Principles of Paleontology (Fall Semester 2020).
📌 Executive Summary
Morphometrics is defined as the quantitative investigation of biological form. It provides a mathematical framework to analyze how shape changes across various biological and geological processes.
Core Takeaways
- Utility: Used to track changes in ontogeny (growth), evolution, and taphonomy (fossilization).
- Primary Tools: Principal Components Analysis (PCA) and its relative, Principal Coordinates Analysis (PCoA), are the essential "workhorse" methods for condensing complex, multi-variable data.
- Visualization: Quantified shapes are plotted in Morphospaces.
- Theoretical Morphospaces: Built using a priori selected variables.
- Empirical Morphospaces: Generated directly from the analysis of the data.
- Functional Inference: We reconstruct the behavior of extinct species using:
- Analogies with living animals.
- The extant phylogenetic bracket (phylogenetic inference).
- Computational modeling and biomechanics.
- Analysis of trace fossils.
- Observed correlations between different phenomena.
- The "Spandrel" Concept: Not every trait is an adaptation; some are merely byproducts of an organism's structural development.
"If you want to inspire confidence, give plenty of statistics. It does not matter that they should be accurate, or even intelligible, as long as there is enough of them." — La po tique de l'espace, Gaston Bachelard (1958)
🛠 Resources & Toolkits
For those wishing to dive deeper, the "PalaeoMath" series by Norm MacLeod is highly recommended. To apply these techniques, consider the following software packages:
- Wolfram Mathematica
- PAST (Paleontological Statistics)
- R (Refer to Mark Bell's "R for Palaeontologists" guide)
Learning Checklist
- Understand the difference between size and shape.
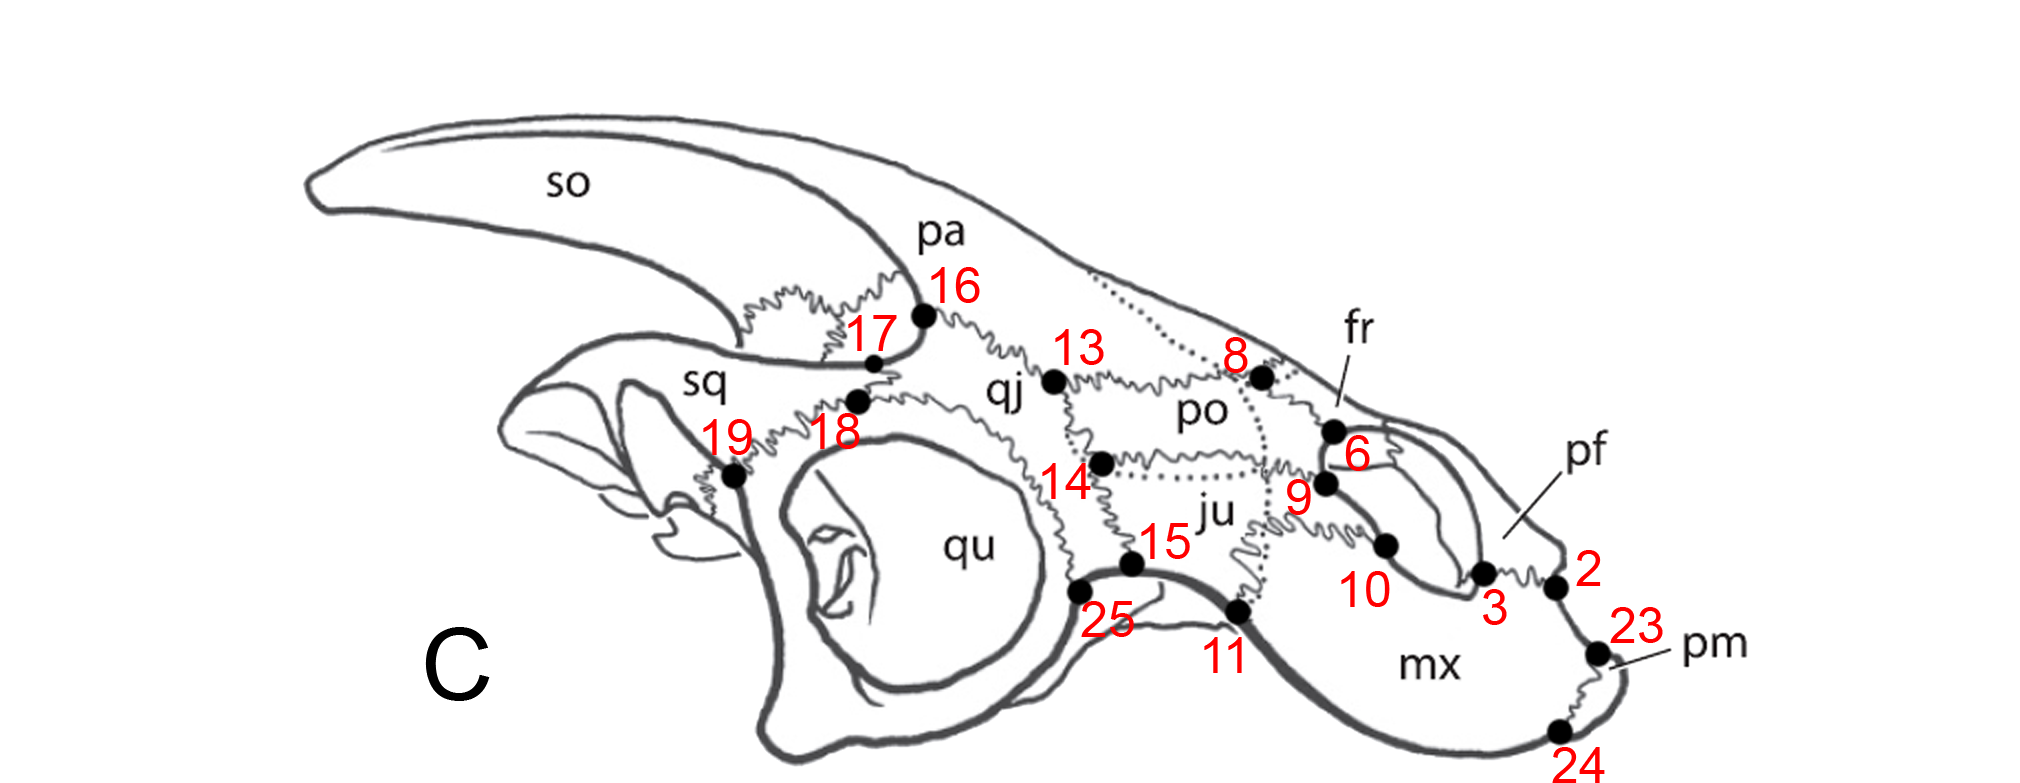
- Distinguish between landmarks and semilandmarks.
- Master the difference between Ordinary Least Squares and RMA regression.
- Be able to interpret a PCA plot.
📐 The Mechanics of Morphometrics
While Raupian attempts to simplify morphology into a few parameters, this often the reality of complex biological systems. However, quantitative rigor is non-negotiable for descriptive paleontology and hypothesis testing.
Defining the Field
Morphometrics is the quantitative study of form, encompassing both size and shape. It is essential for:
- Identifying distinct morphs (e.g., separating taxa, sexes, or age groups).
- Mapping evolutionary or ontogenetic trajectories.
- Performing retrodeformation to reverse taphonomic distortion.
Traditional vs. Modern Approaches
Naturalists have used calipers for centuries, feeding data into multivariate statistics for over a hundred years to describe morphological variation.
Landmark Identification
The process relies on identifying specific points on a specimen for comparison:
| Feature Type | Definition | Examples |
|---|---|---|
| Landmarks | Discrete, homologous points | , suture intersections, vein branching points |
| Semilandmarks | Arbitrary points describing a margin | Points of maximum width, snout tips |

Data Mapping Process
📊 Statistical Analysis of Form
Data is often plotted on a Cartesian coordinate system or a self-generated system based on inter-point distances.
Linear Regression Models
We often use regression to estimate the relationship between two variables.
1. Least-Squares Linear Regression
This method reduces a cluster of bivariate data to a line that minimizes the residuals on the variable.
- Assumption: Variable is the dependent (known) variable used to predict the independent variable .
2. Reduced Major Axis (RMA) Regression
Unlike standard regression, RMA minimizes residuals on both and .
- Benefit: It is invariant to which variable is assigned to which axis.
- Usage: No a priori decision on "dependence" is required.

Phylogenetic Considerations
Biologists often seek correlations between different anatomical parts. For example, analyzing the ratio of bird beak length/depth against tarsal length to determine if larger birds possess proportionately deeper beaks.
Simple correlations are enough. These must be subjected to rigorous statistical analysis to account for phylogenetic relationships.
🖼 Gallery of Concepts
| Concept | Visual Reference |
|---|---|
| General Geology |   |
| PCA Distribution |  |
| Raup's Morphospace |  |
| Comparative Anatomy |   |
Data Example (Pseudo-code)
# Example: Simple distance measurement in R
specimen_data <- data.frame(
  landmark_1 = c(10.2, 11.5, 10.8),
  landmark_2 = c(25.4, 26.1, 25.9),
  taxon = c("Species A", "Species B", "Species A")
)
summary(specimen_data)