Adults over 65 will outnumber children by 2029
The Great Demographic Shift: Seniors to Outnumber Children by 2029

For the first time in the history of the United States, the nation is approaching a demographic "crossover." According to the latest data from the U.S. Census Bureau, the population of adults aged 65 and older is projected to surpass the number of children under 18 by the year 2029.
A Century of Convergence
The trajectory of the American population has shifted dramatically since the mid-20th century. In 1950, the age gap was vast; there were nearly four children for every one senior. However, the lines have been steadily converging for decades.
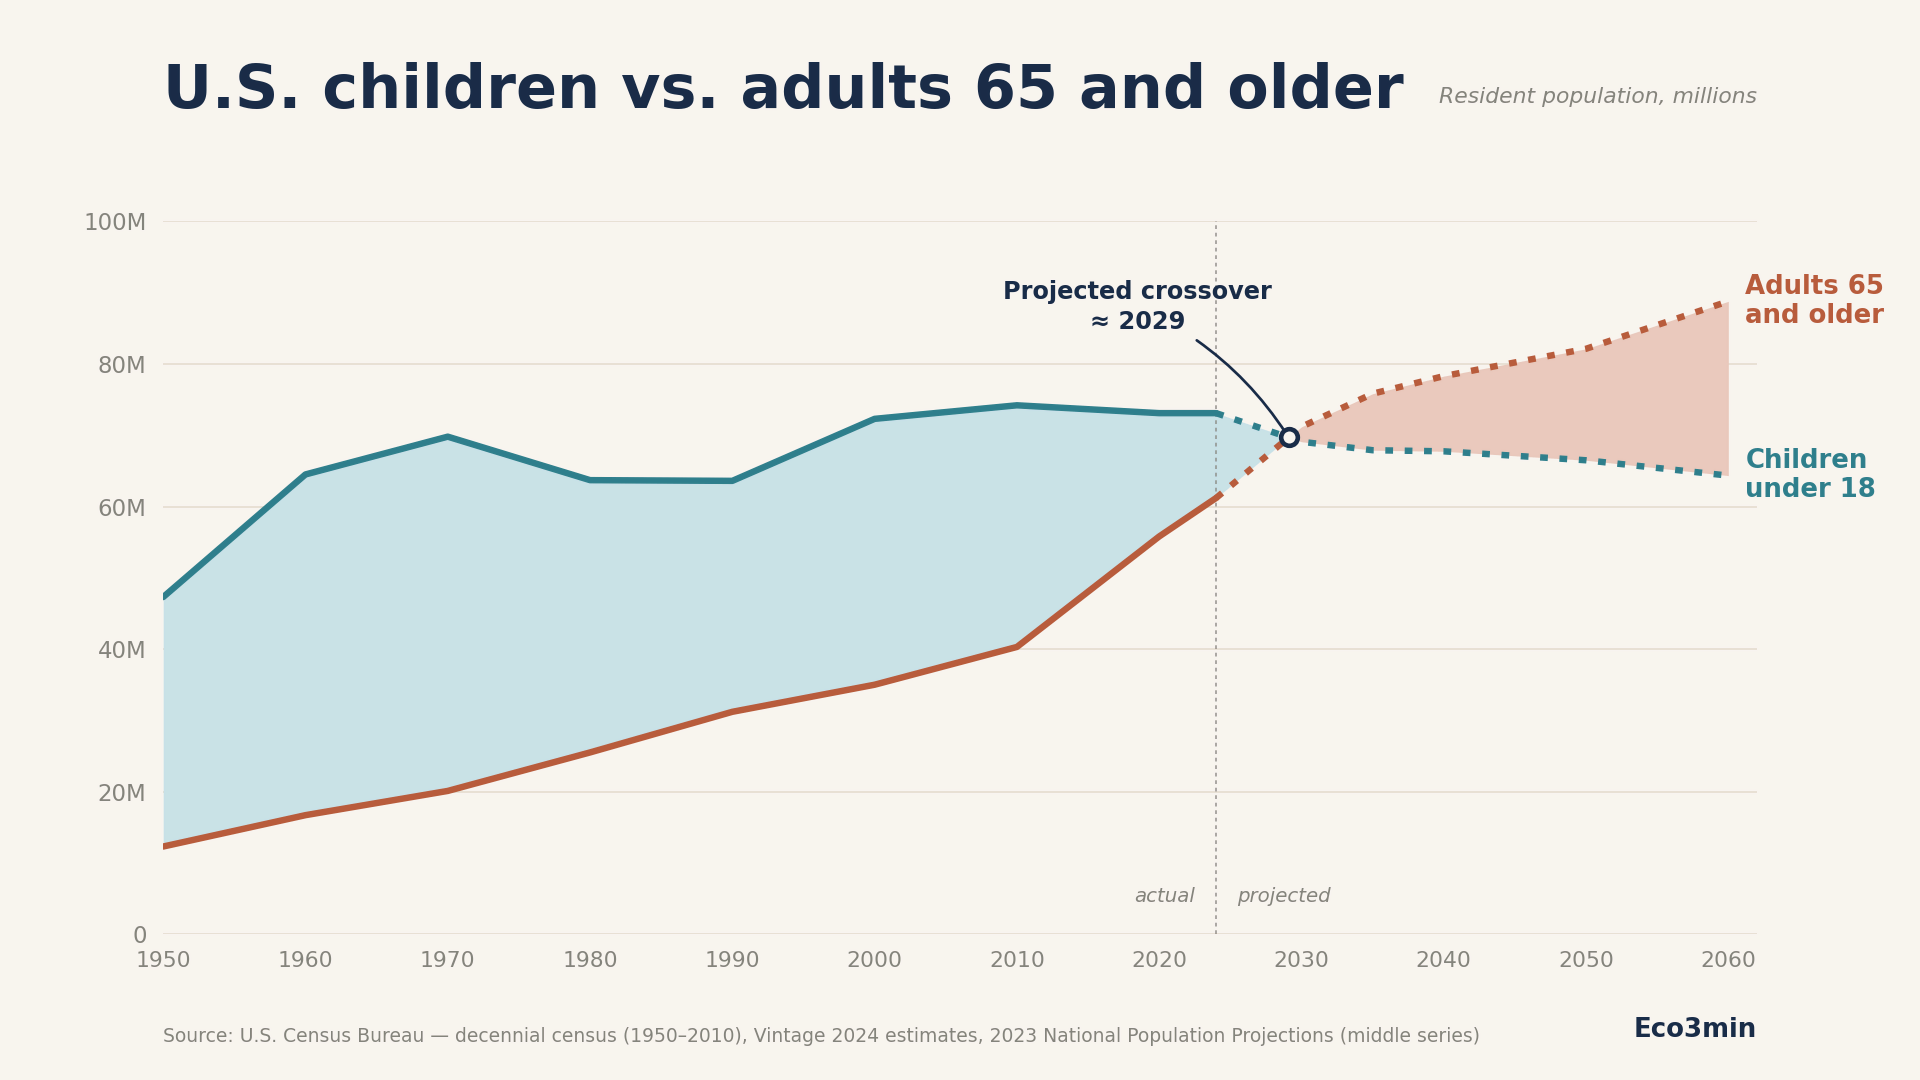
Key Population Metrics: Then and Now
| Metric | 1950 | 2024 (Estimate) | 2060 (Projected) |
|---|---|---|---|
| Adults 65+ | 12.3 Million (8.1%) | 61.2 Million (18.0%) | 24.4% of Pop. |
| Children <18 | ~49 Million (31.3%) | 73.1 Million (21.5%) | 17.7% of Pop. |
| The Gap | Huge (Children lead) | ~12 Million (Children lead) | Seniors lead |
The Growth Dynamics
The rise of the older population has been nearly constant. Between 1950 and 2024, the 65+ cohort grew roughly five-fold. The most aggressive surge occurred between 2010 and 2020, with a growth rate of 38.6%—the fastest increase recorded by the Bureau since the 1880s. This was triggered by the oldest members of the Baby Boom generation (born 1946–1964) hitting the 65-year mark in 2011.
Conversely, the number of children has remained relatively stagnant around 73 million. While the raw number hasn't plummeted, their percentage of the total population has dropped from a peak of 36.0% in 1960 to 21.5% today.
Why the Timeline Shifted
The date of this crossover has been revised. Previously, the Census Bureau estimated this event would occur in 2034.
The Update: The 2023 National Population Projections—which incorporate post-pandemic mortality and fertility rates—have moved the date up to 2029. This five-year acceleration is primarily due to lower-than-expected fertility rates.
Comparing the Projections:
- 2025: Children still lead ( vs seniors).
- 2030: Seniors take the lead ( vs children).
The Three Primary Drivers
This is not a sudden spike, but the result of three long-term forces:
- The Baby Boom Wave: A massive generation moving in unison into the 65+ bracket; all will be seniors by 2030.
- Increased Longevity: Improvements in healthcare mean people are living longer once they reach old age.
- Declining Fertility: The birth rate has remained below the replacement level of children per woman, hovering recently around .
Regional and Economic Implications
This shift is not happening uniformly across the map. The national average is simply catching up to local realities:
- 11 states have already seen seniors outnumber children.
- Nearly 50% of all U.S. counties have already crossed this threshold.
The Economic Pressure Point
This demographic flip creates a significant challenge for the "working-age" population (those 18–64) who fund essential programs like Medicare and Social Security.
# Simplified Ratio Projection
current_ratio = 3.4  # Working-age adults per senior
projected_2060_ratio = 2.4
ratio_decline = current_ratio - projected_2060_ratio
print(f"The support ratio will drop by {ratio_decline} people per senior.")
As the ratio drops from 3.4 today to a projected 2.4 by 2060, the financial burden on the remaining workforce to support the elderly population will increase significantly. By the year 2100, the Bureau projects seniors will make up 29.1% of the population, while children will shrink to 16.4%.