Why your local LLM feels dumber than it is
Why Your Local LLM Feels Dumber Than It Is
1. Introduction: The "Hype vs. Reality" Gap
We've all experienced it: you see a post on Reddit, Discord, or YouTube claiming that Model XYZ is absolutely revolutionary, so you download it—usually a quantized version—only to find that it performs poorly. You're left wondering why your experience doesn't match the hype.
This article is a technical exploration of the implementation-specific hazards that occur during inference. To keep things clear, I will use the term reference implementation to refer to the original lab that published the model, provides the first-party hosting, and issued the initial benchmark claims.
Note: I am not simply running a few prompts through a 2.58-bit GGUF in Ollama. I am also intentionally skipping vast amounts of academic literature and research papers to keep this accessible. Do not nitpick my oversimplifications, or I will force you to read the grueling version filled with complex math.
2. The Variance of the Home Lab
Every single environment running an LLM is unique. A typical home lab might utilize a mix of different GPU generations. Because different instruction sets execute the mathematical operations required to calculate the next token differently, two people running the exact same weights can get different results.
How do you measure the "Suck Factor"?
There are numerous ways to quantify how much your specific setup is degrading performance:
terminal benchhleSWEthisMMLU(and its various iterations)
Crucial Advice: Choose a benchmark that reflects your actual use case. Do not simply set the temperature to zero, run three prompts, and declare the model "bad." To truly find where your setup is failing compared to a reference implementation, you need:
- Domain-specific knowledge evaluations.
- Long-context tool-calling tests.
3. The Mathematical Pipeline
As the saying goes: > "Math is Math!"
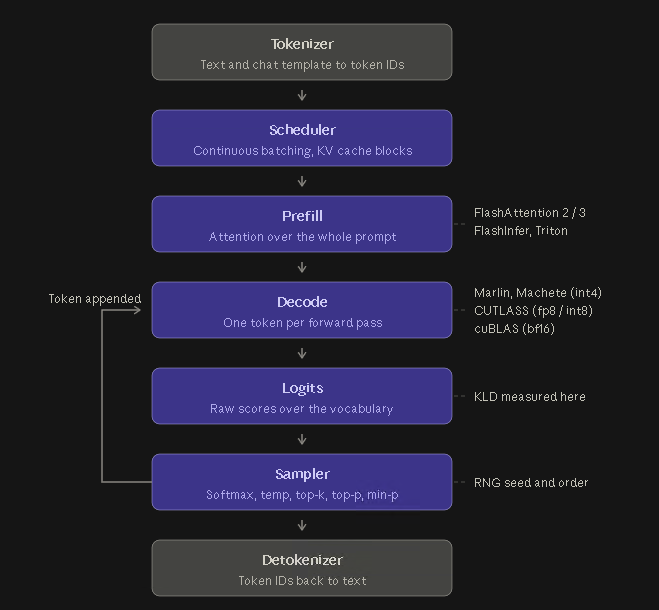
The process of generating a token follows a specific logical flow. The model produces logits, which are then normalized into probabilities, filtered through a sampler, and finally converted back into human-readable text by the detokenizer.
A Note on Samplers
Always check the model card on HuggingFace (HF). It usually specifies the exact chat template and sampler settings required. If you ignore these, you'll run into issues. For example, setting the temperature too low is often why a Qwen model gets stuck in an infinite loop within its <think> output.
When the probability of the next token shifts slightly, the output might change from THE NE XT to THE NE W DAY. While these shifts seem minor, they are often the source of that "something feels off" sensation.
4. Understanding KL Divergence (KLD)
You may have encountered the term KL Divergence. In simple terms, it measures how much one probability distribution deviates from a baseline distribution.
- Lower KLD means the output is closer to the baseline (though not necessarily "smarter").
- Directionality: The order of the distributions matters.
Warning: Be skeptical of incredibly low KLD claims on quantized model cards. A number is meaningless unless the author provides a full disclosure of the following:
- Reference checkpoints used
- Full runtime environment
- Evaluation text and calibration data
- Context lengths and sampled positions
- KL direction
- Vocabulary truncation methods
- Aggregation logic
5. The Software Stack Complexity
The software layer between your hardware and the model is massive. Consider the vllm engine:
A single nightly vllm container image can contain 734 packages (including 252 uv/pip Python packages). Each of these is a separate codebase with its own bugs and quirks. Your specific path through this mountain of code is unique.
6. Test 1: Precision Benchmarking Attention Backends
During the "prefill" stage (processing the initial prompt), the inference engine selects from several attention backends. This choice affects both speed and precision and requires different CUDA kernels depending on the GPU's SM compute capability.

Experimental Parameters
I conducted a test using the following configuration:
| Component | Specification |
|---|---|
| Model | Qwen3.6-27B (Official BF16 Checkpoint) |
| Hardware | RTX PRO 6000 Blackwell GPU |
| Tensor Parallelism | 1 |
| KV Cache | BF16 (No quantization) |
| Execution | Eager (CUDA graphs, prefix caching, and MTP disabled) |
| Prefill | 2k-token chunked |
Model Architecture & Workload
Qwen3.6-27B is a dense hybrid model. It consists of 64 layers following a specific pattern:
- 3 Layers: Gated DeltaNet / linear-attention.
- 1 Layer: Full-attention.
In this experiment, only the 16 full-attention layers were subjected to the selectable attention backends; the Gated DeltaNet path remained constant.
For the workload, I used "Prompt 2": a ~100k token context derived from a real Turnstone lab workstream. This included actual tool calls and work products, making it far more representative of a real-world local agent than a synthetic "needle-in-a-haystack" test. Crucially, this data does not exist in any training set or public benchmark.
# Conceptual representation of the layer loop
for layer in range(64):
    if layer % 4 == 0:
        execute_full_attention(backend=selected_backend)
    else:
        execute_gated_deltanet()