LLMs: Intelligence vs. Cost
LLMs: Balancing Intelligence and Expenditure
Published September 1, 2026
The website ArtificialAnalysis (AA) provides a critical service by benchmarking the cognitive capabilities of various Large Language Models (LLMs). Their primary metric, the Intelligence Index, is derived from the average results of a curated set of benchmarks. While this serves as a helpful "rough estimate" of a model's overall smarts, AA also tracks the financial cost of executing these benchmarks.
Because the tests are standardized, these costs provide a relative proxy for what an end-user will pay. This is a vital consideration: using a "frontier" model for a trivial task is efficient a complete waste of resources.
The Flaws in the Original Visualization
Despite its utility, the plotting method used by AA is frustrating for several reasons. I believe their current approach is misleading:
| Issue | Why it's problematic |
|---|---|
| Logarithmic Scaling | It masks the gargantuan price gap between budget models and premium ones, while exaggerating tiny differences between cheap models. |
| Official API Pricing | It relies on developer-set prices, ignoring the fact that open-weights models are often significantly cheaper via third-party providers. |
| Local Model Mispricing | Models capable of running on consumer hardware are listed at datacenter rates, which no local user would actually pay. |
Key Insight: To optimize costs, one should use
OpenRouterto switch providers dynamically and secure the lowest possible rate.
A New Approach to Visualization
I have reconstructed these plots using AA's intelligence scores but applying a more realistic cost framework.
Understanding the Intelligence Metric
When interpreting the intelligence axis, keep these guidelines in mind:
- point: Likely imperceptible to the average user.
- points: A substantial and noticeable difference in capability.
- Baseline: A score of
50represents the state-of-the-art as of February 2026 (specificallyOpus 4.6).
The Three-Tiered View
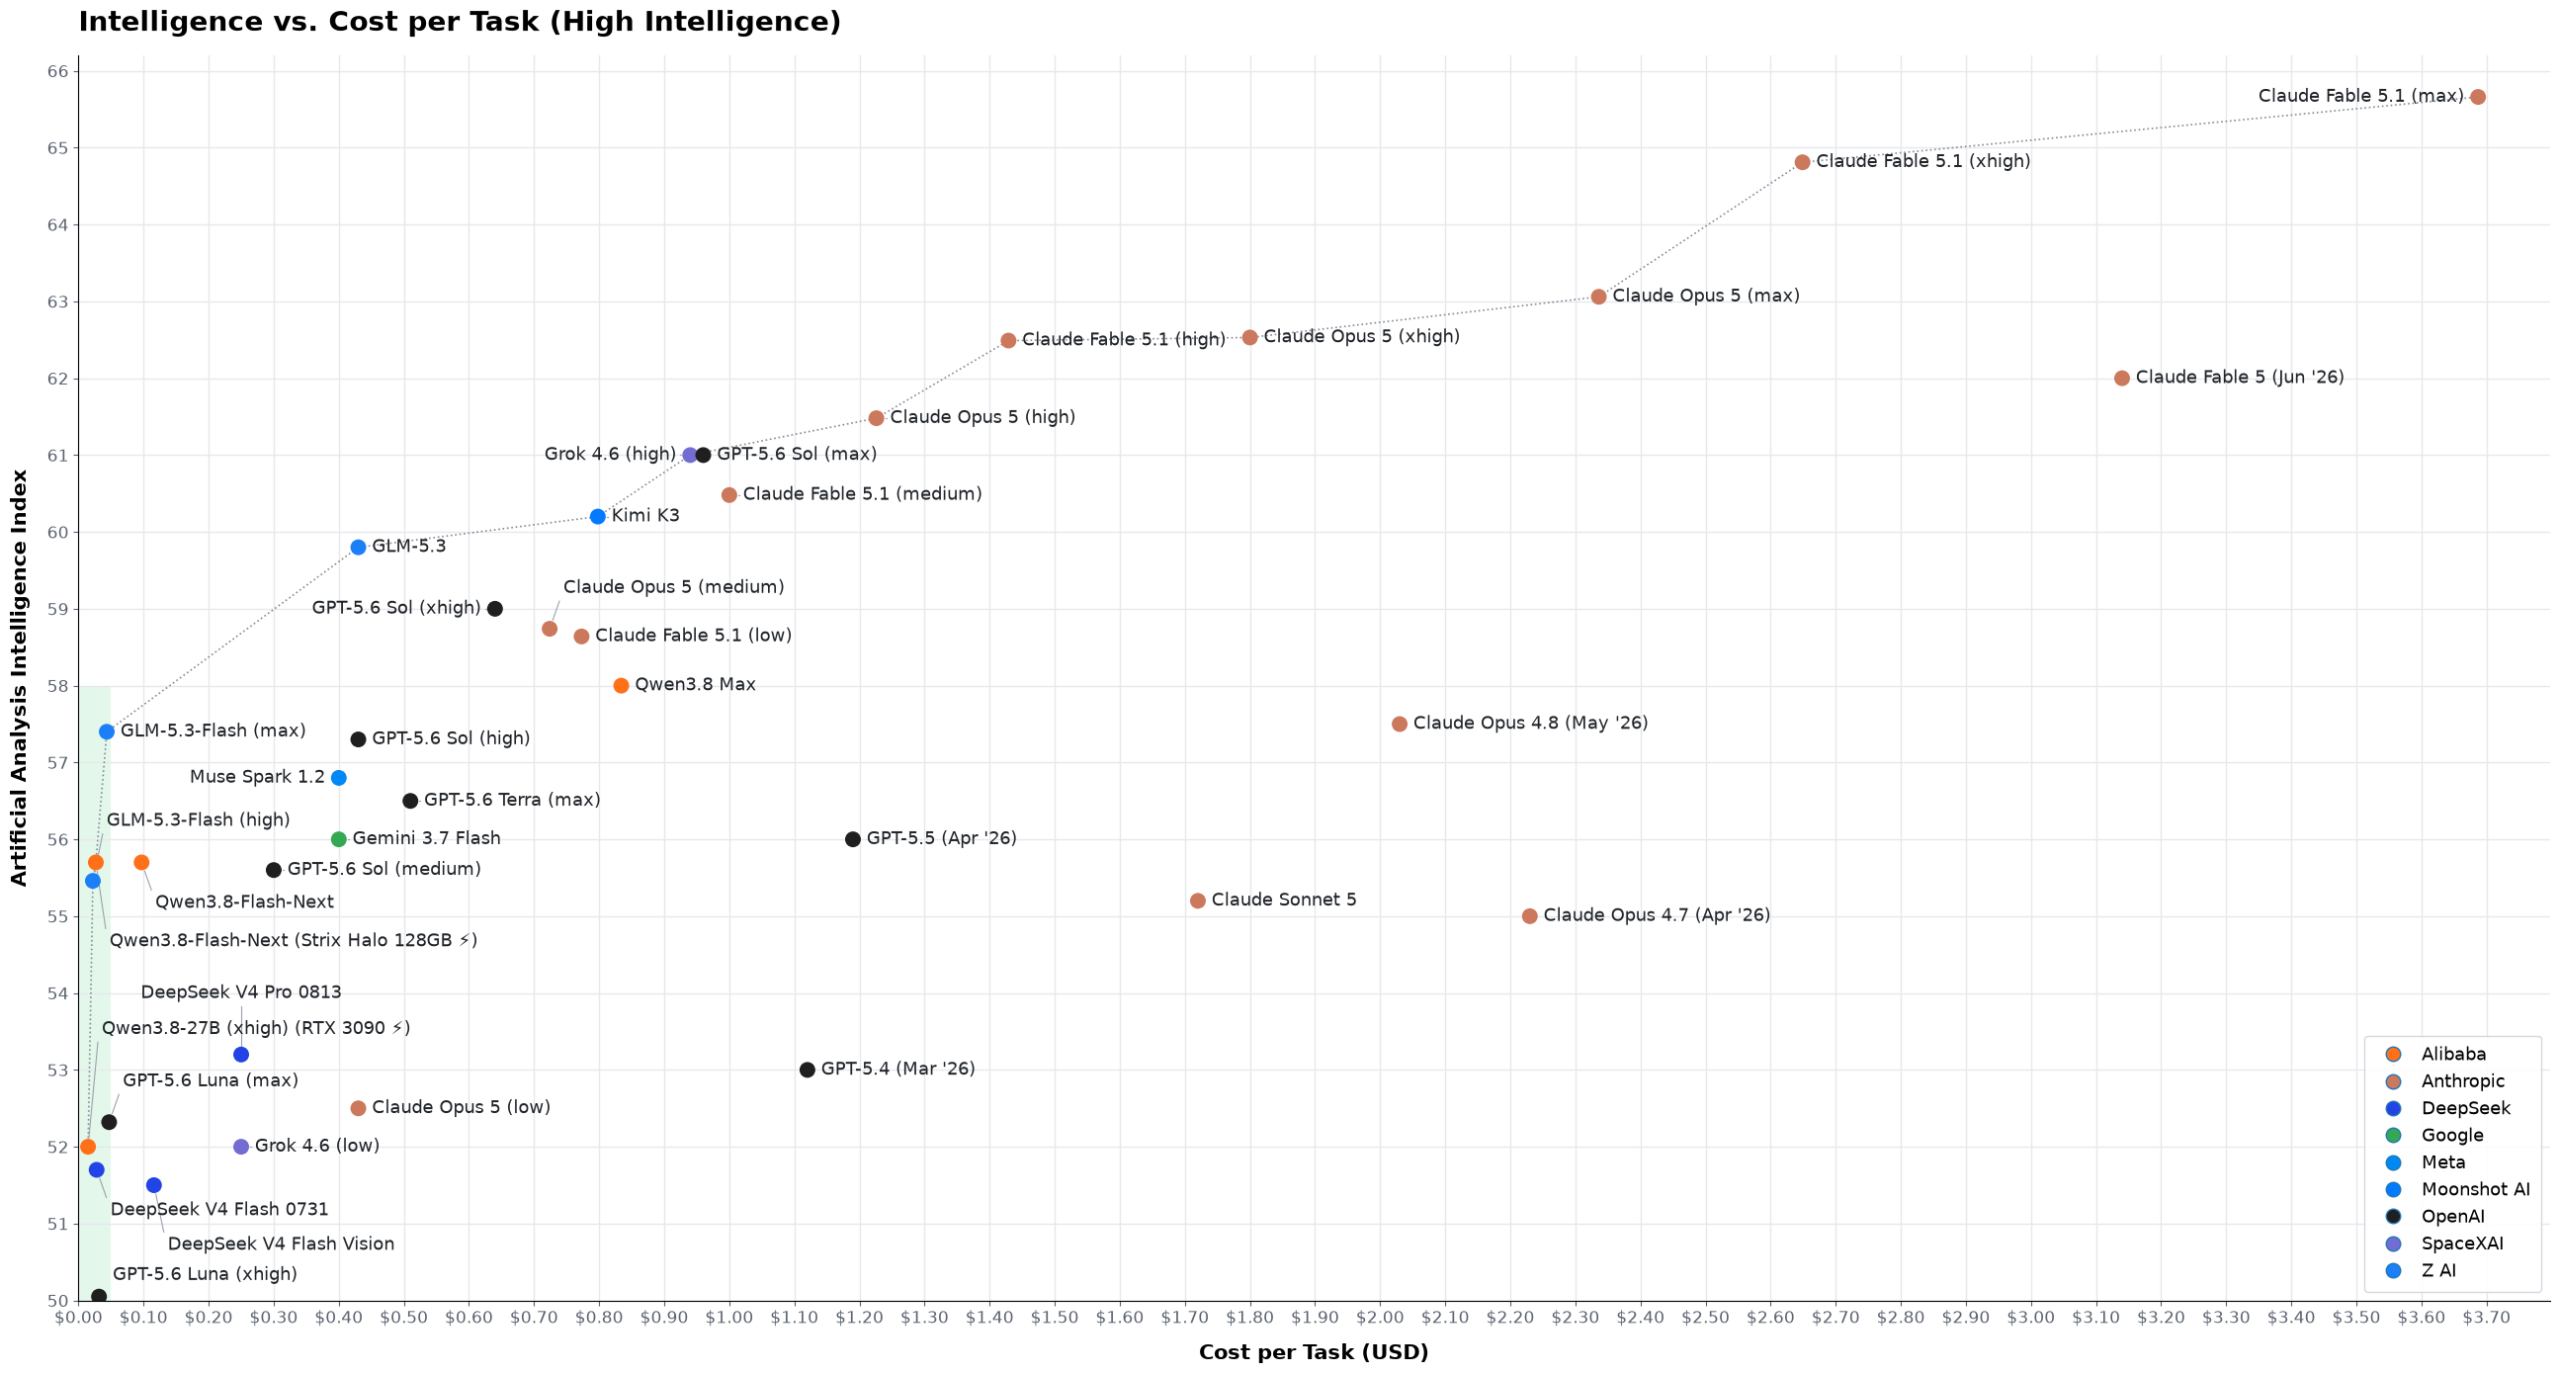
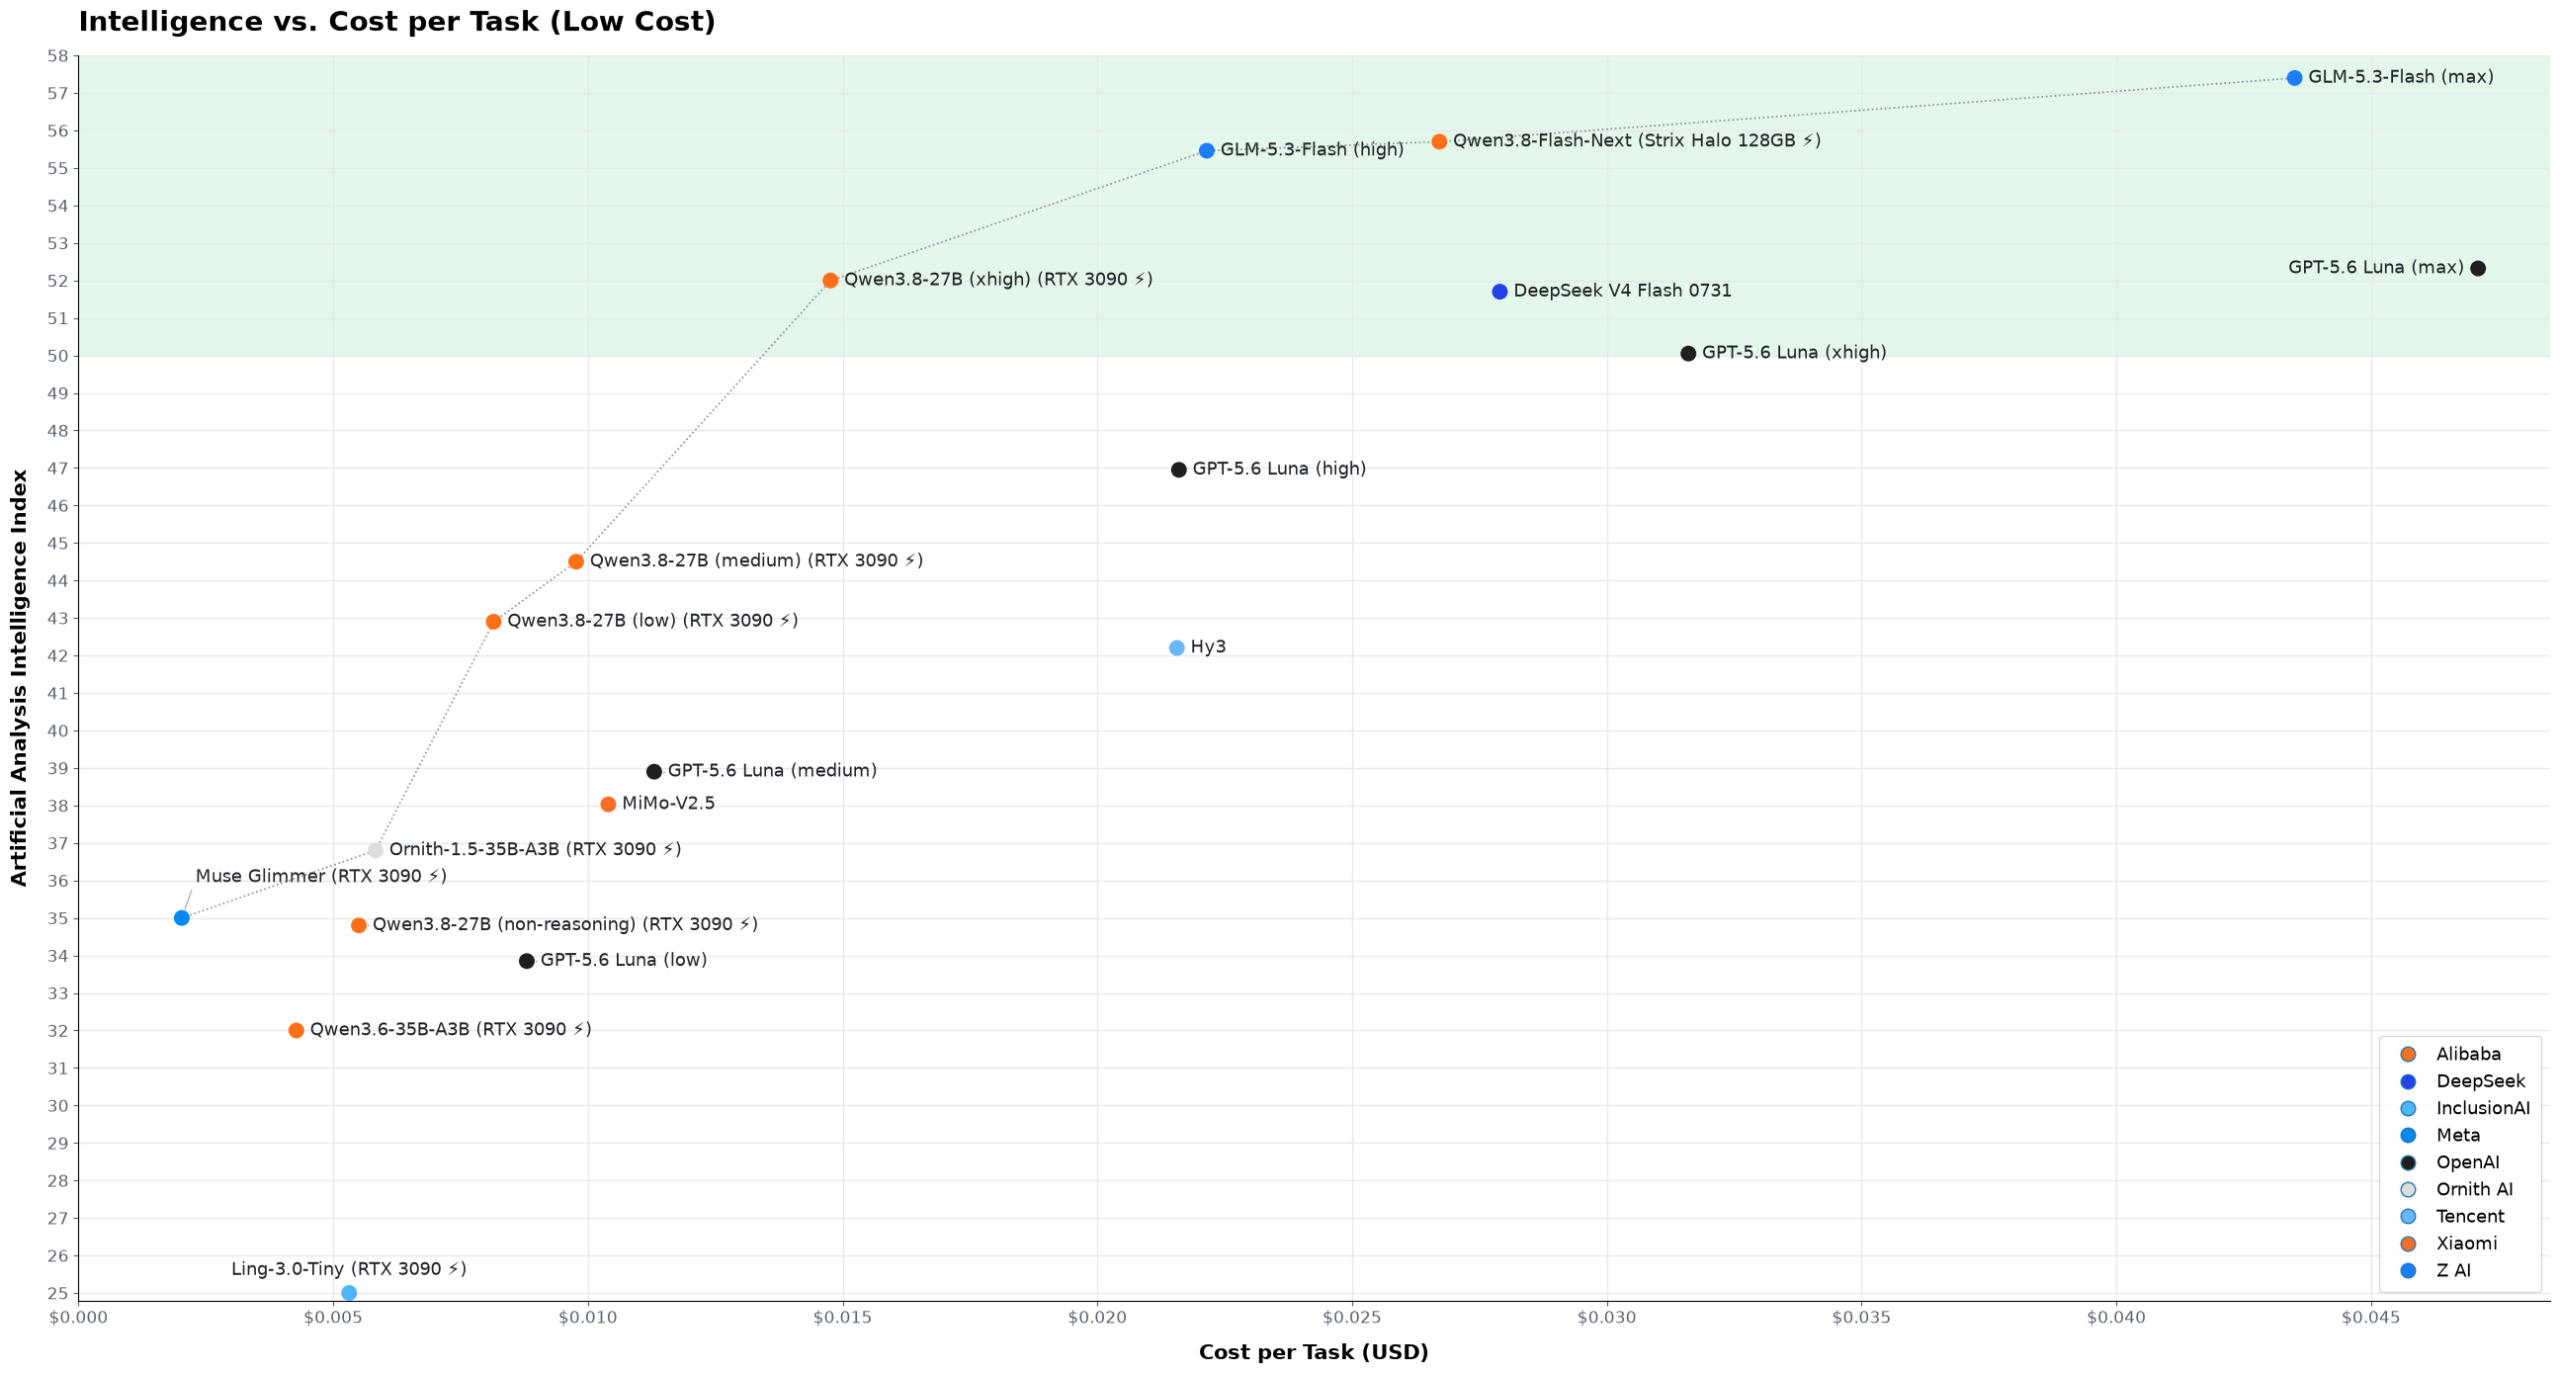
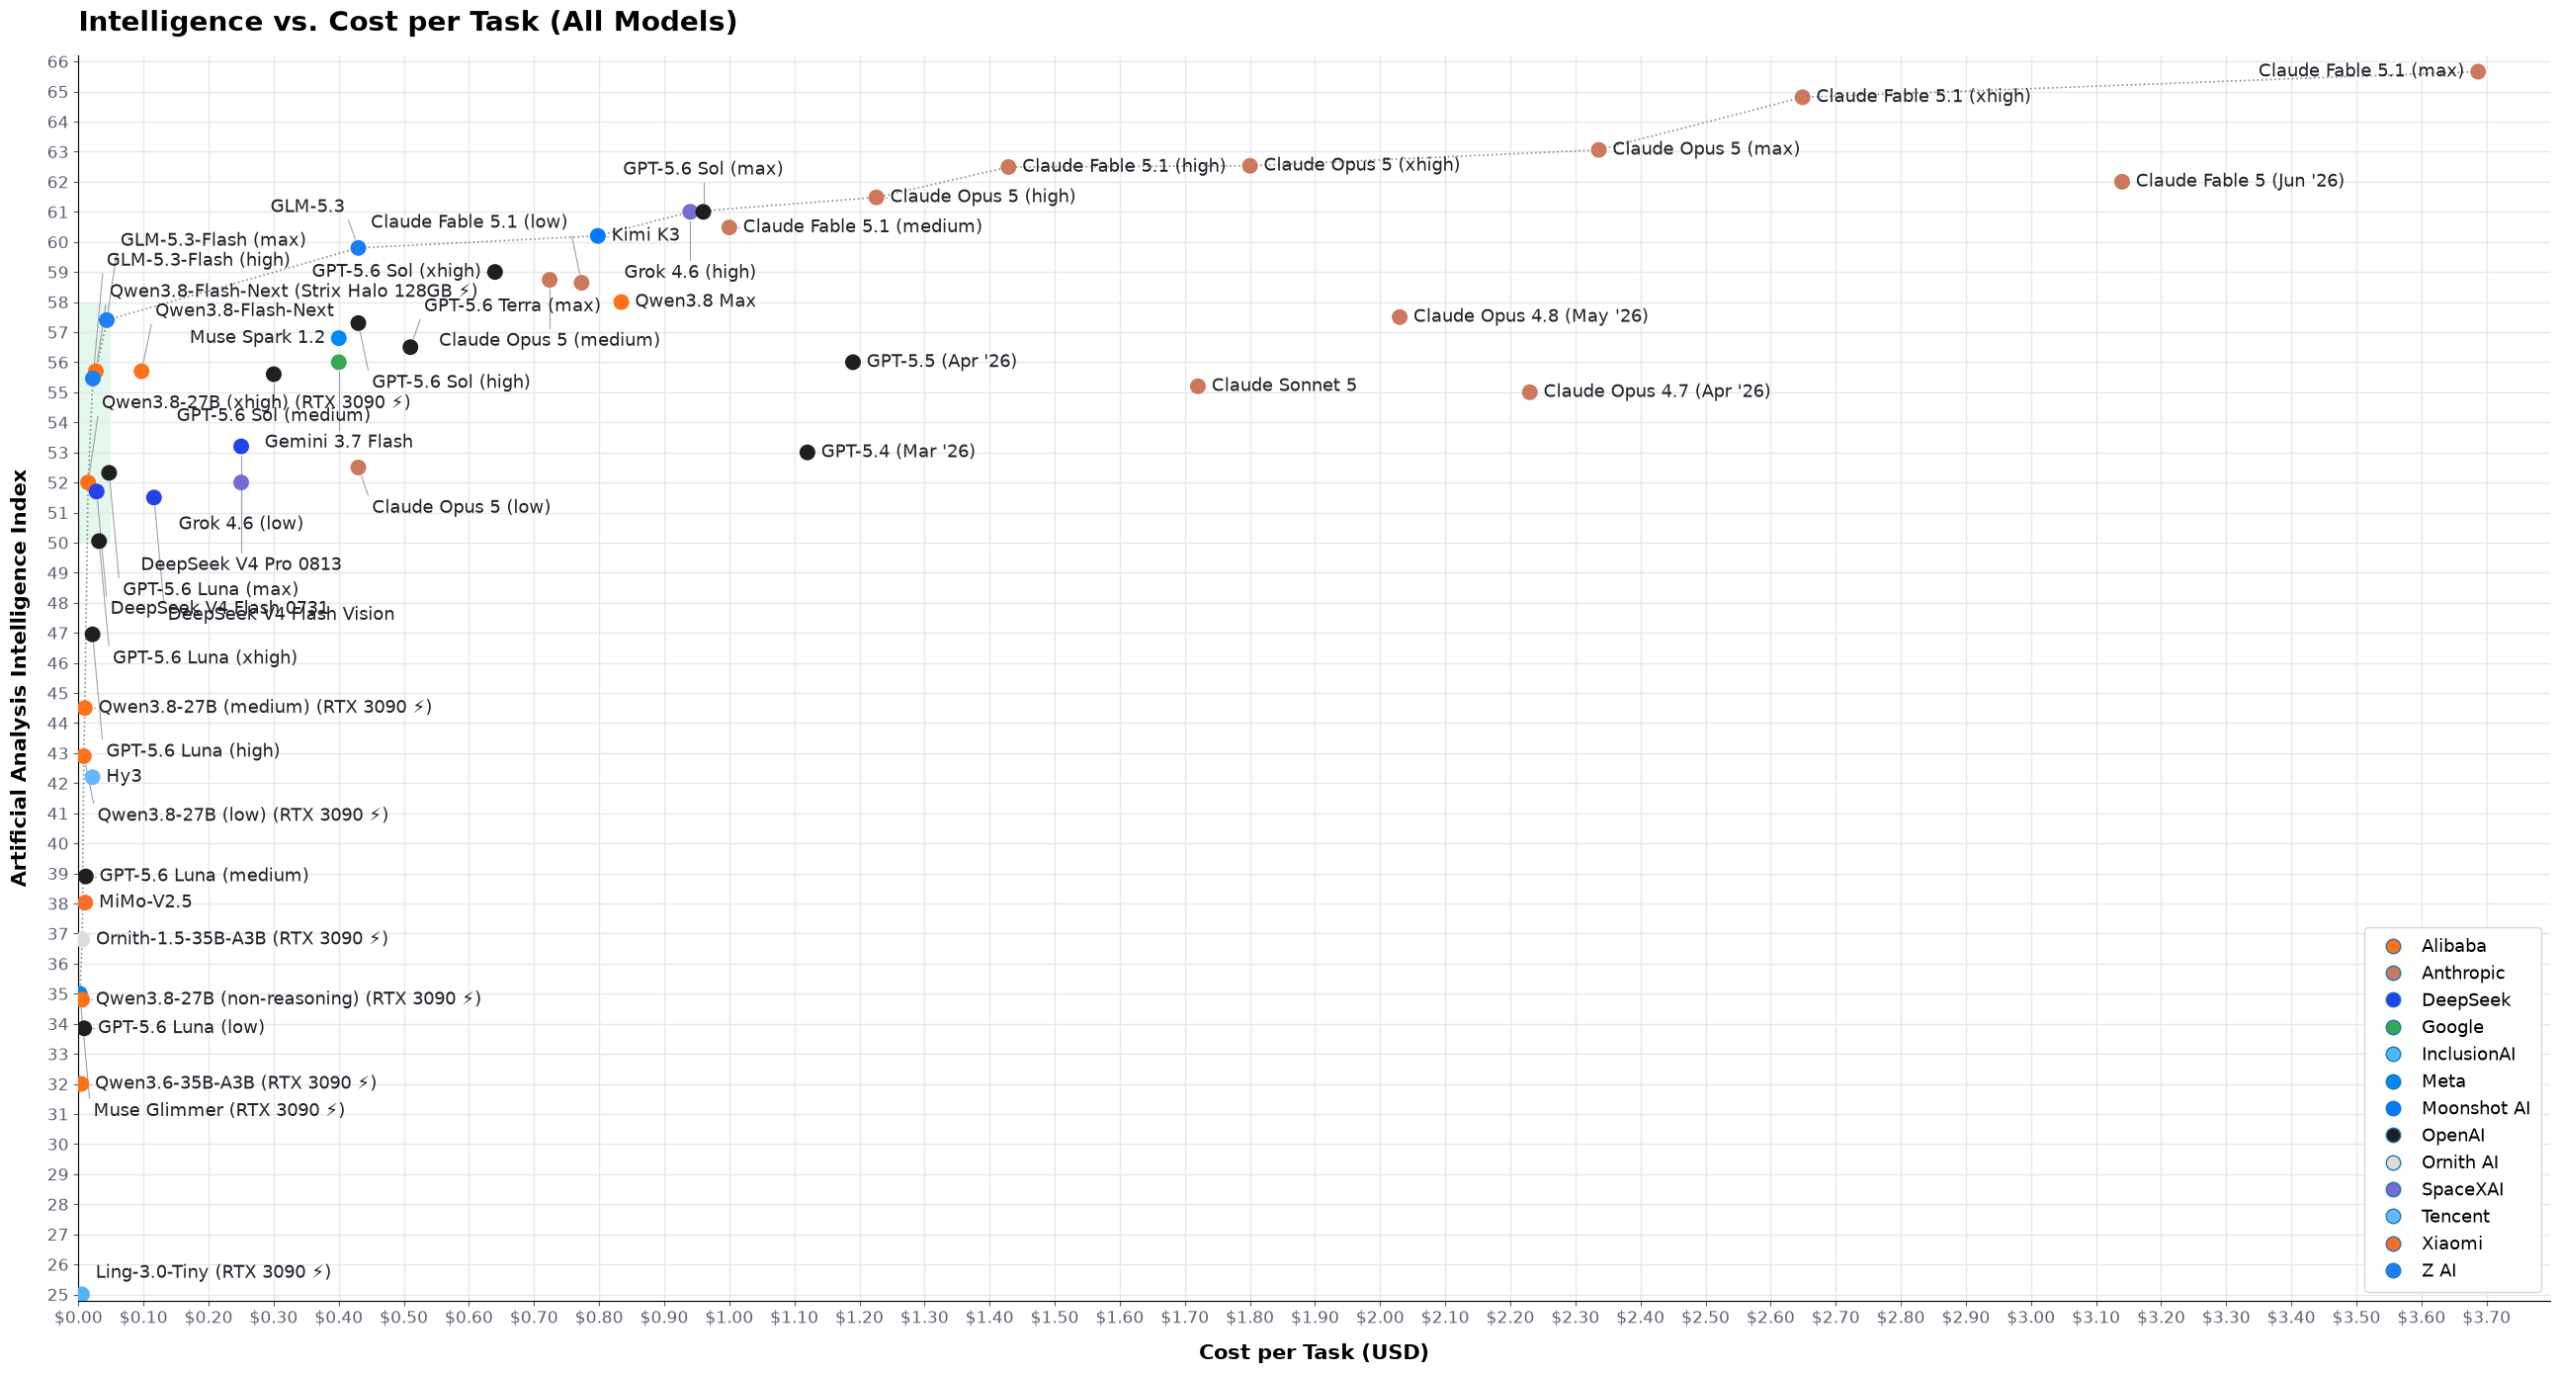
I created three distinct visualizations to better illustrate the landscape:
- High-Intelligence Tier: Focuses on the most capable (and pricey) models.
- Low-Cost Tier: Zooms into the "green zone" where models are extremely affordable, extending down to smartphone-capable models.
- The Unified View: Merges both to highlight the diminishing returns of paying for more intelligence.
Methodology and Data Adjustments
To arrive at these plots, I implemented the following changes:
- Swapped the x-axis from logarithmic to linear (because budgets are linear).
- Updated pricing for
Kimi K3,Qwen3.8 Max,DeepSeek V4 Flash 0731,GLM-5.3,GLM-5.3-Flash, andHy3using OpenRouter rates (filtering for reliability and Zero Data Retention). - Extrapolated
GLM-5.3-Flashhigh-reasoning scores by combining AA data with Z.ai coding benchmarks. - Replaced datacenter pricing with local electricity costs for models under 35 billion parameters.
- Integrated
Ornith-1.5-35B-A3B(using self-reported scores, which should be viewed with skepticism).
Calculating Local Execution Costs
For models marked with ⚡, the cost per task was determined using the following logic:
The mathematical formula for the electricity cost is roughly:
Hardware Assumptions:
- GPU: Used an RTX 3090 (~$1,400 used).
- Electricity: Weighted US average of \0.2049/\text{kWh}$ (May 2026).
- Hardware Cost: Set to \0$ for machines under 64GB RAM, as these are standard gaming/workstation builds.
The Hardware Threshold
While ignoring hardware costs is fair for general-purpose PCs, it fails once you exceed 64GB of RAM.
For example, Qwen3.8-Flash requires at least a 128GB Strix Halo. While I show both the datacenter price and the local electricity cost for this model, the electricity figure is deceptive because it ignores the massive hardware premium:
- 64GB Strix Halo: \approx \2,000$ (Useful for many tasks).
- 128GB Strix Halo: \approx \3,600$ (Primarily only useful for high-end AI).
 Additional context images:

