The UN challenges five centuries of cartography

The UN challenges five centuries of cartography
Charting the age of uncertainty
September 9, 2026 | By Amanda Shendruk
Happy Wednesday! If you find value in this newsletter, please consider supporting my work via a one-time donation or by becoming a paying subscriber. 💙
The Great Map Shift
It is quite rare for the technicalities of map projections to dominate international headlines. However, the UN recently passed a resolution encouraging the use of maps that accurately represent the actual size of continents, effectively dethroning replacing the 500-year-old Mercator projection.
The vote was nearly unanimous, heavily supported by the African Union:
- In Favor: 164 nations
- Opposed: 1 nation (the classic
American Exception ™️)
"Maps shape our understanding of the world," remarked Robert Dussey, the foreign minister of Togo, prior to the vote.
For nearly five centuries, the Mercator projection has skewed this understanding in favor of the West, artificially inflating the size and perceived importance of northern regions at the expense of the rest of the globe.
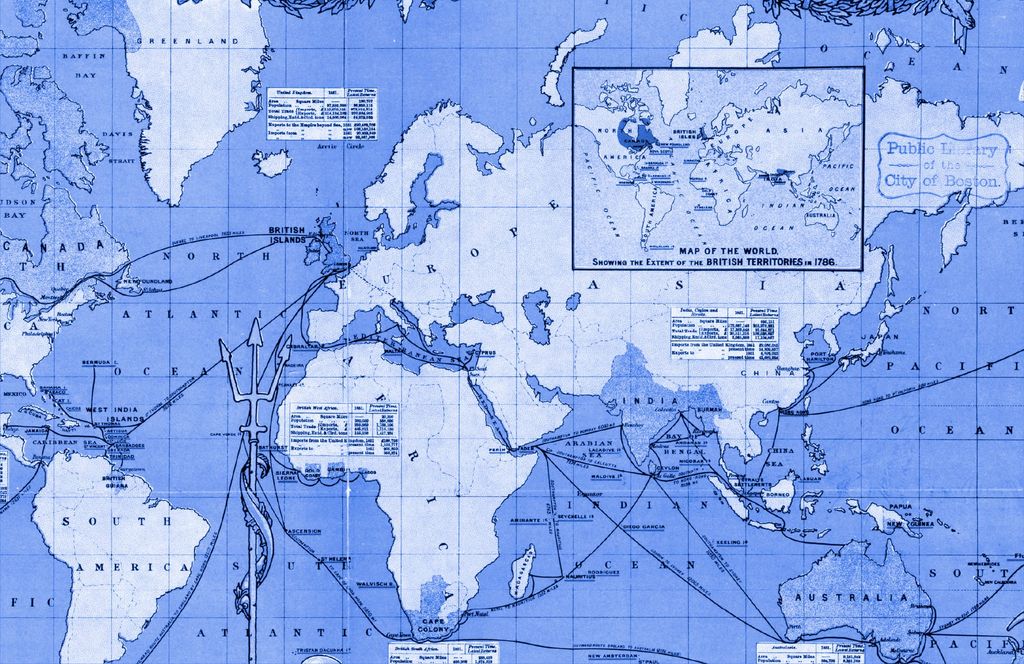
Mercator: A Tool for Sailors
Created in 1569 during the Age of Discovery, the Mercator projection is still widely used today (most notably by Google Maps). Its primary utility is that any straight line drawn on the map represents a constant compass bearing.
While excellent for navigation, it fails at geographic accuracy. As you move away from the Equator, distances and areas become increasingly exaggerated. This results in a disproportionate inflation of:
- North America
- Russia
- Europe
Because humans often subconsciously equate physical size with power or importance, this projection reinforces a narrative of northern superiority over the Global South. This very debate was even featured in the television show The West Wing.
Seeking a Better Perspective
The Gall-Peters Projection
The alternative suggested in The West Wing is the Gall-Peters projection. This map prioritizes an "equal-area" perspective.
In mathematical terms, if a landmass occupies a certain percentage of the Earth's surface: (e.g., if a country is 1% of the Earth, it takes up 1% of the map).
However, flattening a sphere onto paper requires trade-offs. To keep the area accurate, Gall-Peters must distort the shapes:
- Poles: Land is vertically compressed.
- Equator: Land is vertically stretched.
In 2017, Boston Public Schools adopted Gall-Peters to "decolonize the curriculum," but the mapping community was skeptical, arguing that the stretched shapes were simply another form of distortion.
Equal Earth: The Modern Standard
To resolve the conflict between Gall-Peters and Mercator, the Equal Earth projection was developed in 2018. It maintains the area accuracy of Gall-Peters but reduces the extreme shape distortion by using curved lines rather than straight ones.
Comparison of Projections
| Projection | Primary Goal | Main Strength | Main Weakness |
|---|---|---|---|
| Mercator | Navigation | Constant compass bearings | Inflates poles/North |
| Gall-Peters | Equal Area | True relative size | Distorts shapes (stretched) |
| Equal Earth | Balance | True size + better shapes | Some polar distortion |
Ultimately, all maps involve a series of choices. For the UN, these choices are political and ethical. As stated in the resolution:
"Correcting cartographic distortions of continental sizes constitutes an act of cognitive justice and memorial reparation."
Bonus: Other Ways to See the World
To keep the main narrative concise, I omitted two other notable projections:
- Winkel Tripel (1921): A compromise designed to minimize distortion in area, direction, and distance. National Geographic adopted it in 1998. It is computationally complex and slightly inaccurate in some country sizes.
- Dymaxion (1943): Created by Buckminster Fuller, this unfolds the Earth as a polyhedron. While largely unusable for standard navigation, anthropologists value it for visualizing historical migrations and connected landmasses.
Map Evaluation Checklist
- Does it preserve relative area?
- Does it maintain recognizable shapes?
- Is it useful for the intended purpose (navigation vs. education)?
- Does it avoid reinforcing geopolitical biases?
Readers Respond
Last week, I encouraged readers to get better at debunking one another. Some of you took that literally and turned the debunkers on me.
Point 1: The Tense Trap One reader noted that by asking, "Do you remember how Covid-19 spread?" (past tense), I inadvertently suggested that the pandemic is entirely over—which is a falsehood.
Point 2: The Misinformation Paradox Merrill, a data reporter at the Washington Post, questioned a statistic suggesting that "very liberal" people are the least susceptible to fake news, while "very conservative" people are the most.
Merrill's critique is as follows:
Is it actually flattering that we are "less susceptible,"
or is the data skewed because the quiz tests the ability
to recognize mainstream media headline styles?
The concern is that "very liberal" respondents might be better at spotting right-coded disinformation, but might still struggle with overstated claims regarding climate change or Trump/Russia narratives.
Rest assured this isn'...