Prisma's pgbouncer=true on Supabase made every query 4 round-trips (postmortem)
Postmortem: How pgbouncer=true in Prisma Cost Us 4 Round-Trips per Query
On the evening of September 14, 2026, a potential guest attempted to book a stay at Mara Hilltop (the lodge I own and operate in the Maasai Mara). Every time they selected their dates and clicked "Continue," the page crashed.
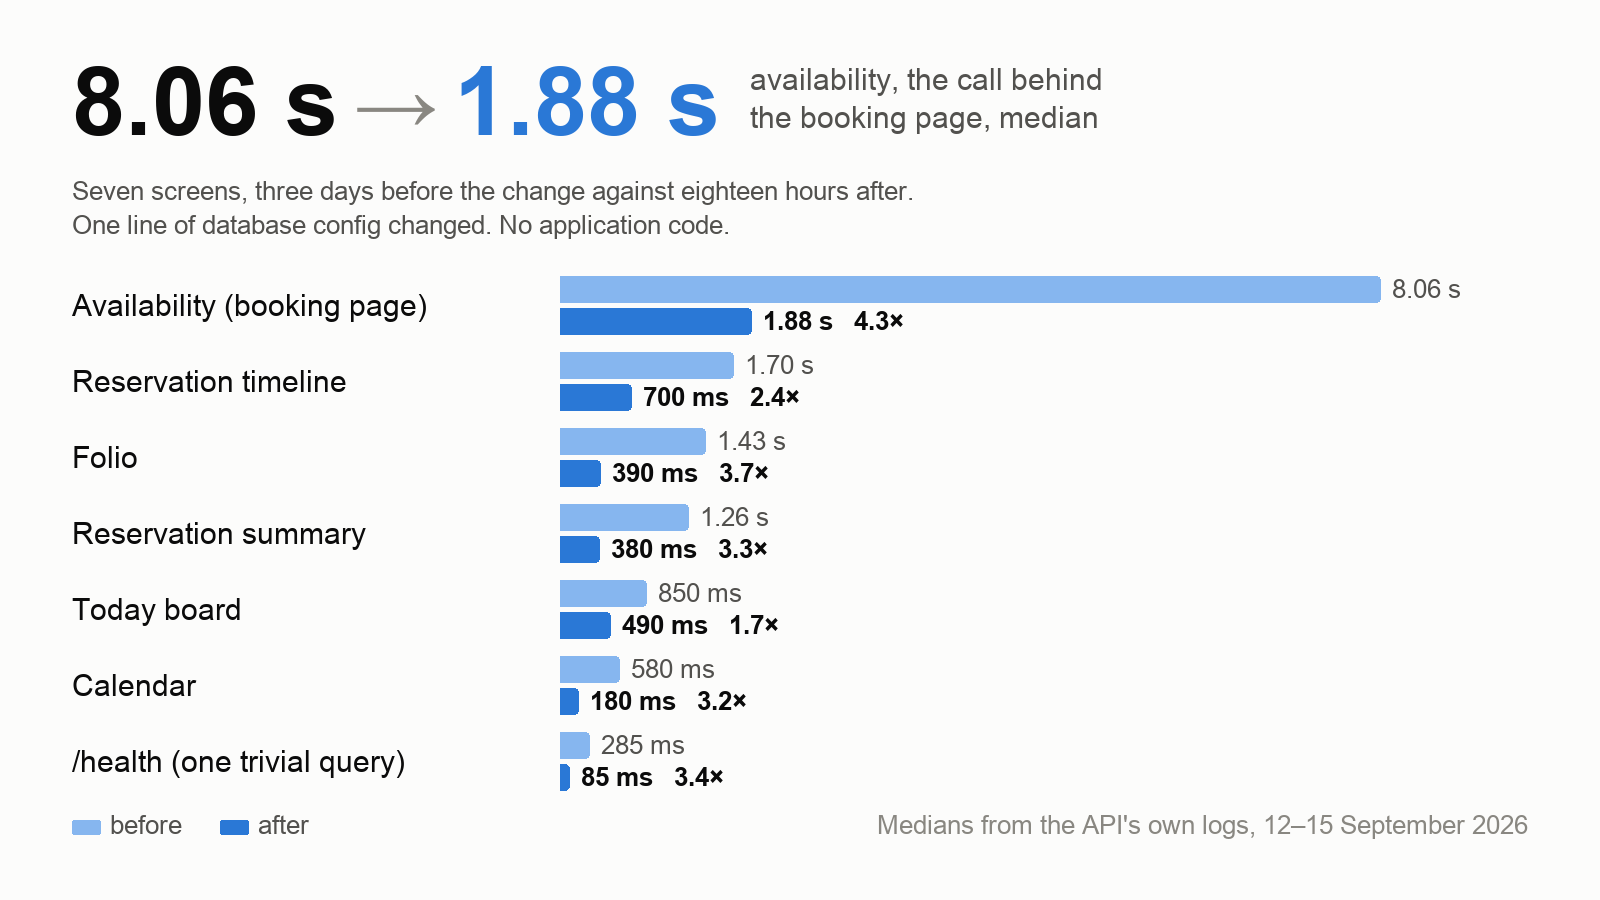
While fixing the crash, we stumbled upon a database configuration error that had been silently degrading our performance since March in KaribuKit, the software powering the lodge. By changing a single setting, we slashed the availability check response time from 8.06 seconds down to 1.88 seconds.
The crash was a quick fix; the systemic slowness is the real story.
Part 1: The Memory Crash
The guest encountered the iOS "Chrome page could not be opened" screen. This typically occurs when the browser's content process is killed twice consecutively—usually due to memory exhaustion.
The Culprit: Unoptimized Assets
Our booking page was serving raw camera files for room photos. A preloader was fetching the entire gallery for every room type the moment availability was confirmed.
| Metric | Value |
|---|---|
| Total files fetched | 36 |
| Total wire size | 47 MB |
| Total decoded size | 3.9 GB |
| Largest single image | 8171 5957 px ( MB) |
Because my laptop has significant RAM, I couldn't reproduce the crash. However, an iPhone cannot handle a 3.9 GB memory footprint.
The Fix: Claude Code (Anthropic's CLI agent) had actually suggested a fix on August 26: use the Next.js image optimizer for resized copies and kill the preloader.
The fix sat in a pull request for 19 days because I misread my notes. Once merged, the raw fetches dropped from 36 to zero.
Part 2: The "Ghost" in the Latency
While verifying the fix, I timed the availability request (the API call checking room vacancy).
- Localhost (no network): seconds.
- Median logs: seconds.
/healthendpoint: ms (performs oneSELECT 1and a Redis ping).
The Math of Geography
Our API is hosted on a Hetzner box in Helsinki, while our Supabase DB is in Dublin. A TCP connect test showed a round-trip time (RTT) of 47 ms.
"The network is just slow because of the distance." This was our accepted explanation for six months.
A History of Misdiagnosis
We launched on March 27. By March 31, I had implemented a performance spec adding Server-Timing and X-DB-Queries headers.
- The Baseline: The folio endpoint took 2,667 ms for 10 queries.
- The Calculation: .
We assumed this was simply the cost of the Helsinki Dublin trip. We recommended moving the infrastructure closer to reduce latency from to .
Our "Optimization" Checklist:
- Reduced reservation page requests (68 handful)
- Cached user lookups
- Enabled gzip
- Added keepalive for idle tabs
- Patched auth refresh (4 times)
- Deployed Cloudflare in August
None of these touched the fundamental cost of a single query.
Part 3: The Root Cause
The issue was the interaction between Prisma 5.22 and the Supabase transaction pooler (Supavisor).
Transaction Mode vs. Session Mode
Supavisor offers two modes:
- Transaction Mode: Assigns a connection per transaction. It cannot support prepared statements.
- Session Mode: Pins a backend to the client connection. It does support prepared statements.
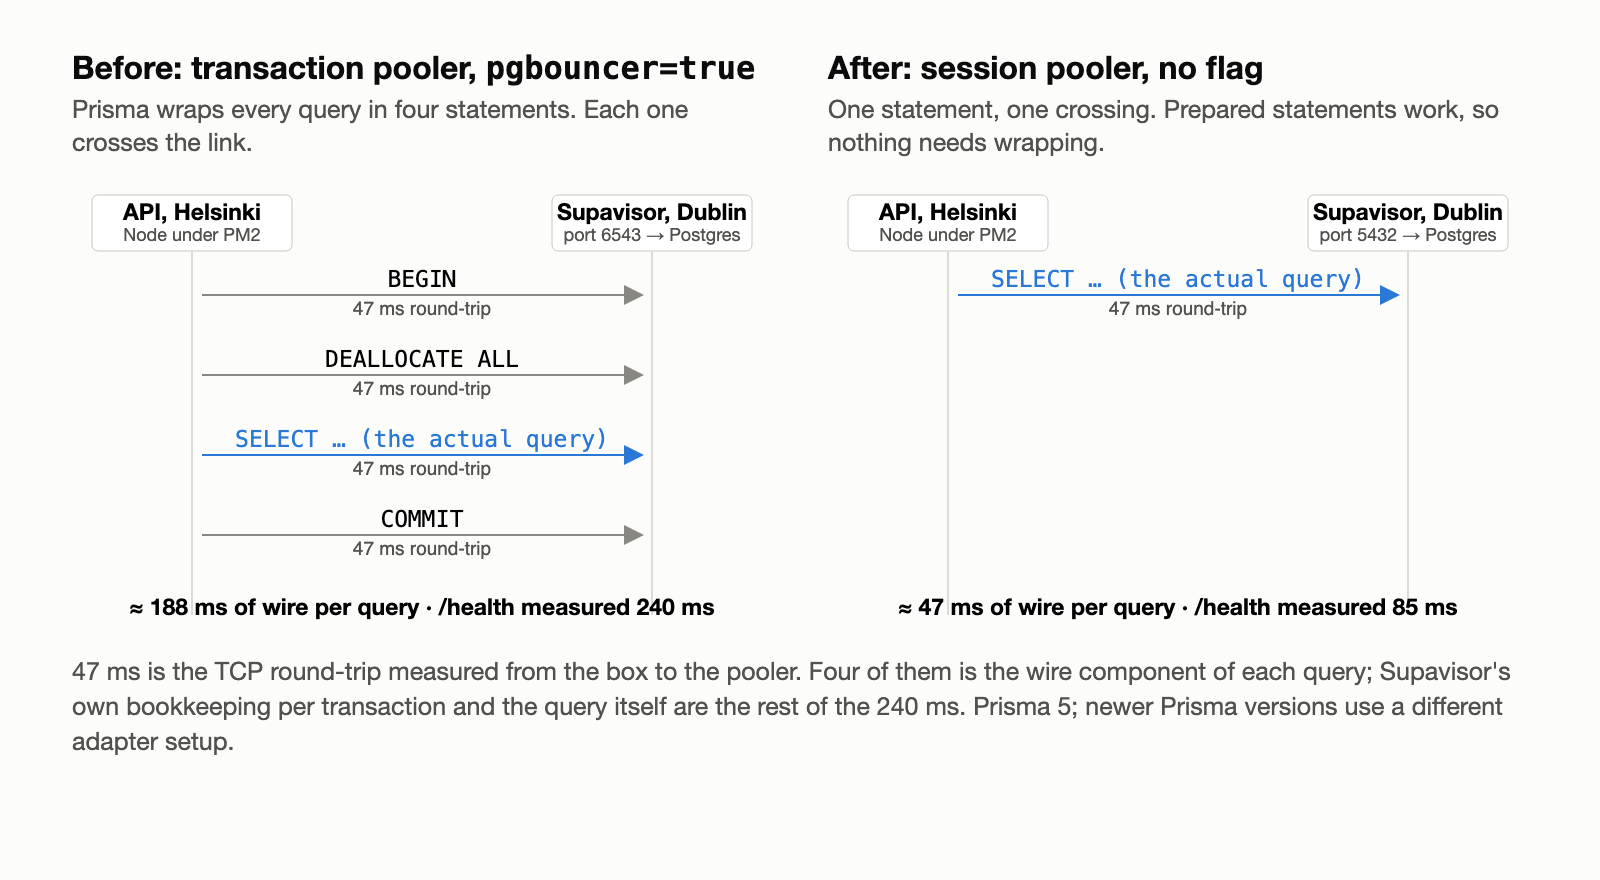
Because we used Transaction Mode, we added the pgbouncer=true flag to our Prisma connection string. This flag forces Prisma to wrap every single query in a specific sequence to avoid prepared statement errors.
The Cost of the Cycle
Each of those four steps is a round-trip.
The remaining time ( for the health check) was spent on the query itself and pooler overhead.
The Evidence from pg_stat_statements:
BEGIN: 4,053,716 callsDEALLOCATE ALL: 4,053,574 callsCOMMIT: 4,053,080 calls- Total server-side time for
DEALLOCATE ALL: Only 9.6 seconds (the cost was the trip, not the execution).
The availability endpoint makes 38 sequential queries. At seconds per query, that explains the -second load time.
The Resolution
We had followed the "serverless" recipe (Transaction mode) instead of the "long-running server" recipe (Session mode). We simply updated the .env file to point to the session port and removed the flag.
Configuration Change:
# OLD (Transaction Mode - Port 6543)
DATABASE_URL="postgres://...:6543/postgres?pgbouncer=true"

# NEW (Session Mode - Port 5432)
DATABASE_URL="postgres://...:5432/postgres"
Visual Evidence