Can we stop with the uptime percentages?
Is it Time to Retire Uptime Percentages?
On 2026-09-03, I came across a piece by Jason Gorman titled “The Wall Confronting Reliable Coding Agent Autonomy.” In it, he makes a poignant observation:
The journey from 90% to 99% reliability is just as difficult as the initial climb to 90%.
This resonated with me deeply, especially since I've noticed a trend of increasing stability instability in my daily workflow.
The Status Page Struggle
Whenever things feel "off," I find myself navigating to various service status pages. I'm usually greeted by a sea of colors and statistics, often claiming something like 100% uptime.
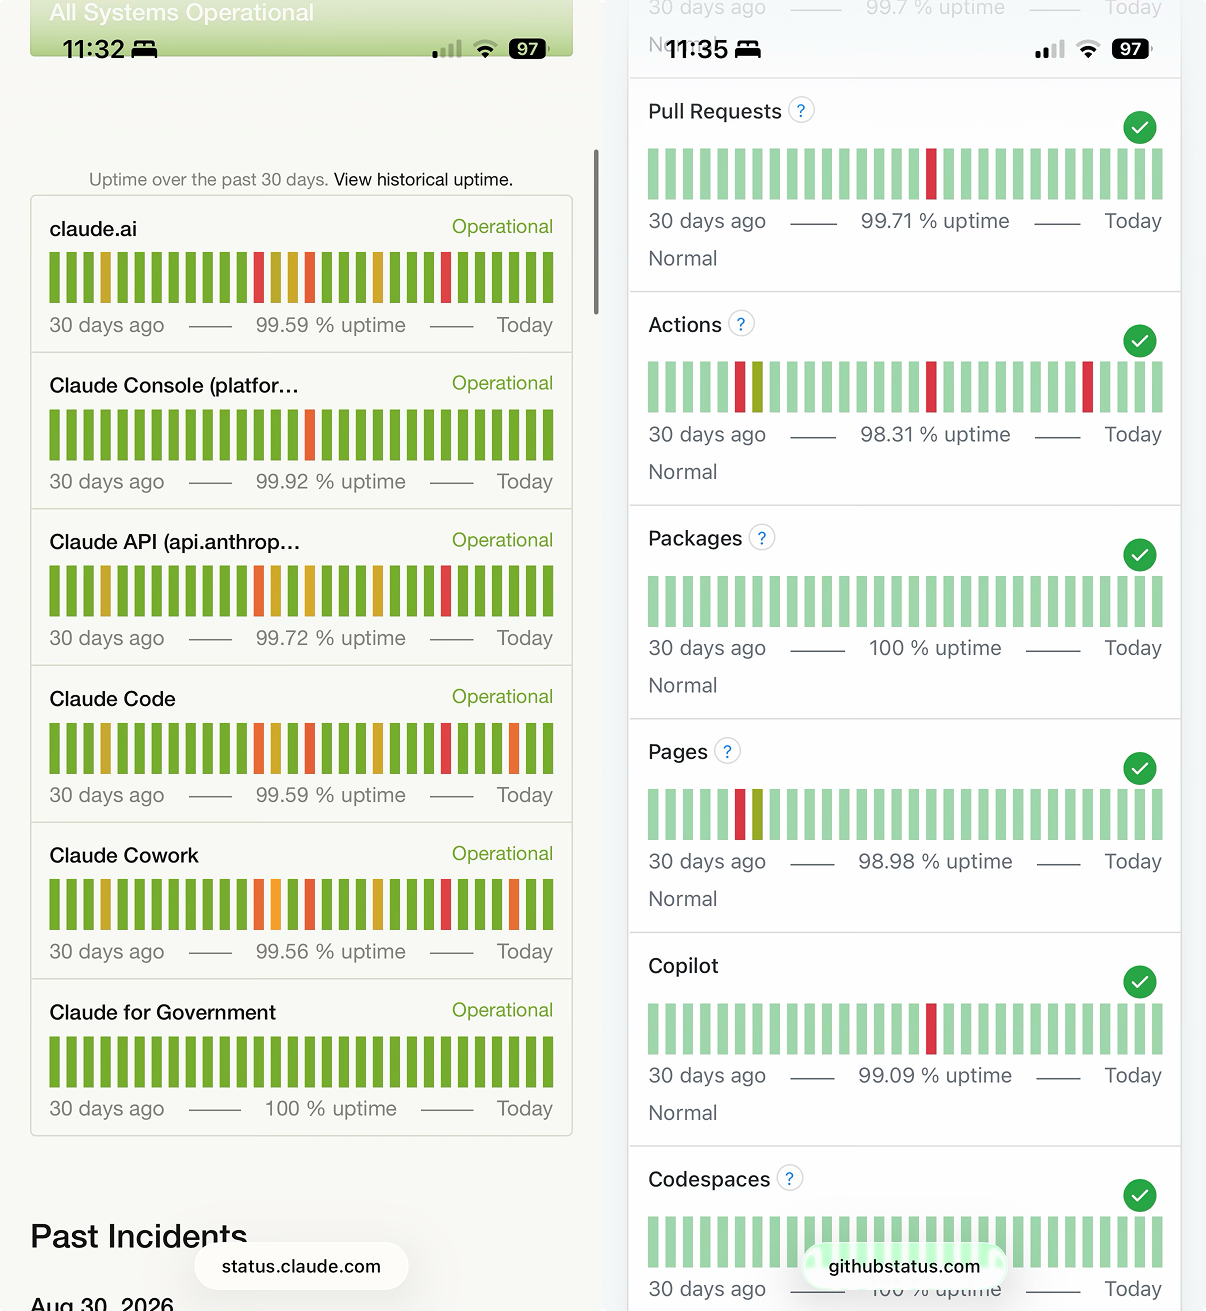
When I see these numbers, I have to consciously apply Gorman's logic to translate them. It feels less like reading a report and more like interpreting seismic data.
The Magnitude Problem
In seismology, the gap between a and a earthquake might look small numerically, but the actual energy released is vastly different. Uptime metrics suffer from the same non-linear deception:
- 99.9% looks almost identical to 99.99%.
- In reality, the latter represents 10 less downtime.
The "Nines" Hierarchy
Infrastructure engineers have developed a shorthand to cope with this:
- "Two nines"
- "Three nines"
- "Four nines"
While those who live in the server room intuitively understand these distinctions, the general public—who now frequently use status pages—does not.
A Flawed Interface
Status pages serve as the primary window into a service's reliability. However, they are currently designed for compliance and standardization rather than human communication.
Most users aren't looking for a standardized industry metric; they just want to know:
"Dude, how much have you been down lately? It feels like a lot..."
Comparing the Approaches
| Current Method (Technical) | Proposed Method (Human) |
|---|---|
98.31% uptime | 12 hours affected in the last 30 days |
| Requires non-linear mental math | Immediate, tangible impact |
| Focuses on the "up" time | Focuses on the "down" time |
The Logic of Downtime
To understand why percentages fail us, consider the math. The amount of allowed downtime for a given percentage over a time period is:
If we want to calculate this programmatically, it looks like this:
def calculate_downtime(percentage, days=30):
    total_minutes = days * 24 * 60
    downtime_minutes = total_minutes * (1 - (percentage / 100))
    return downtime_minutes

# Example: 98.31% uptime over 30 days
print(f"{calculate_downtime(98.31)} minutes of downtime")
A Better Path Forward
We should stop relying solely on the "nines." Instead, we should prioritize clarity.
Checklist for a Better Status Page
- Move away from percentage-only displays.
- Lead with actual time lost (hours/minutes).
- Keep the percentage as a secondary, parenthetical detail.
- Use plain language instead of "infra-speak."
The Bottom Line: Instead of saying GitHub Actions: 98.31% uptime, why not say: GitHub Actions: 12 hours affected in the last 30 days (98.31% uptime)? One requires a math degree in reliability; the other just requires a clock.