Burning Man Death Rates – A Short Lesson in Statistics
Burning Man Mortality Rates: A Statistical Deep Dive
By Viraj Shah | September 27, 2026
Executive Summary: In 2026, three individuals passed away at Burning Man. While this represents the highest death toll in the event's history, it is actually significantly lower than what the general US crude mortality rate would predict ( deaths). Even when adjusting for age, we would expect deaths. The historically low death rate at Burning Man is likely a result of selection bias—the event attracts a healthier-than-average demographic.
The Incident
During the 2026 Burning Man gathering, there were three confirmed deaths. Because the event has maintained a near-zero death rate for over three decades, these three fatalities garnered significant media attention and were viewed as abnormally high.
However, from a statistical perspective, we must ask: Is three deaths actually an anomaly when compared to the broader US population?
Analyzing the Demographics
To answer this, we look at the Black Rock City Census 2025 Population Report. While we are analyzing 2026 deaths, we assume the demographic makeup remained consistent with the 2025 data.
Key Attendee Characteristics:
- Loyalty: are returning participants.
- Ethnicity: identify as white.
- Education: hold at least a bachelor's degree.
- Wealth: There is a high concentration of affluent attendees; the group earning between
$100,000and$299,999annually makes up over one-third of the population.

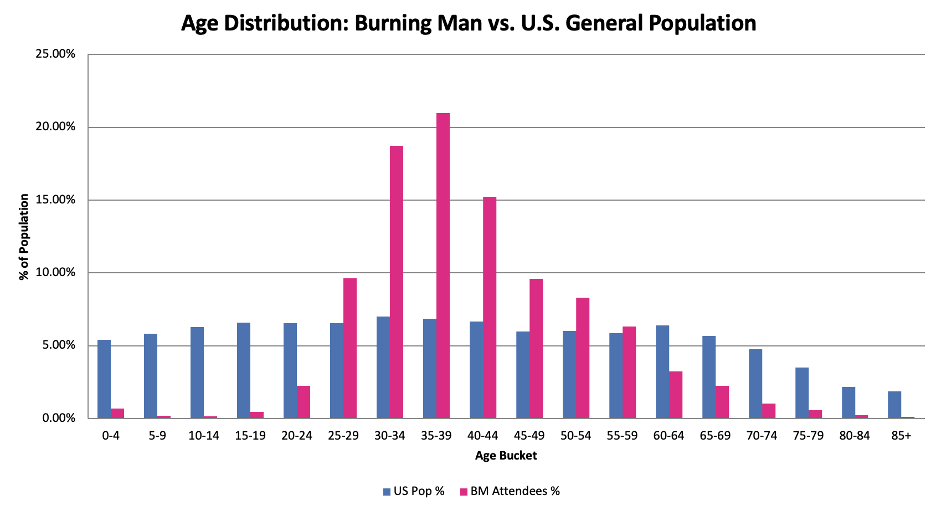
The Burning Man crowd is not a representative sample of the US general population. Most notably, the attendee age distribution is skewed significantly younger than the US average, which is critical because mortality rates climb sharply with age.

The Crude Mortality Calculation
First, let's look at the "crude" rate—the raw average without adjusting for any demographics.
The Variables:
- US Crude Mortality Rate:
909.3deaths per 100,000 people per year. - Burning Man Population: people.
- Duration: week.
Using LaTeX for the calculation:
Conclusion: If we randomly plucked 70,000 Americans and watched them for a week, we would expect roughly 12.2 deaths. Compared to this, the 3 deaths observed at Burning Man are remarkably low.
Age Standardization
Since the Burning Man population is younger, wealthier, and more educated, the crude rate is misleading. To get a more accurate number, we use Age Standardization.
The Process:
- Identify age-specific death rates for the US population.
- Map these rates to the specific age brackets of Burning Man attendees.
- Sum the expected deaths for each bracket.
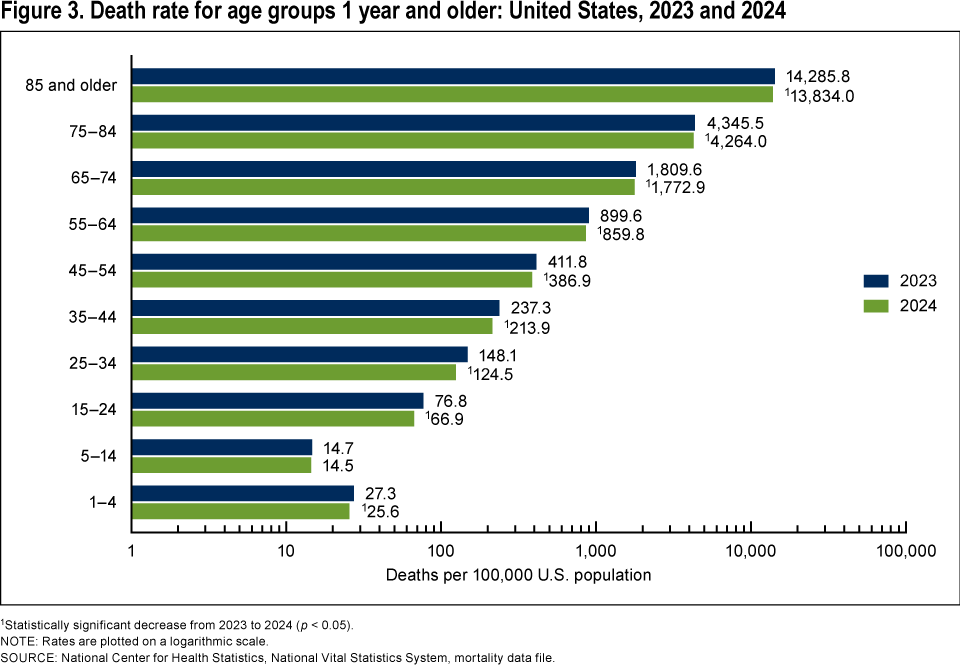
By applying these specific rates (where the 75-84 group has a vastly higher rate than the 20-29 group), the expected death toll drops from 12.2 to 4.9.
Comparison Table: Expected vs. Observed
| Method | Expected Deaths | Observed Deaths | Difference |
|---|---|---|---|
| Crude US Rate | |||
| Age-Standardized |
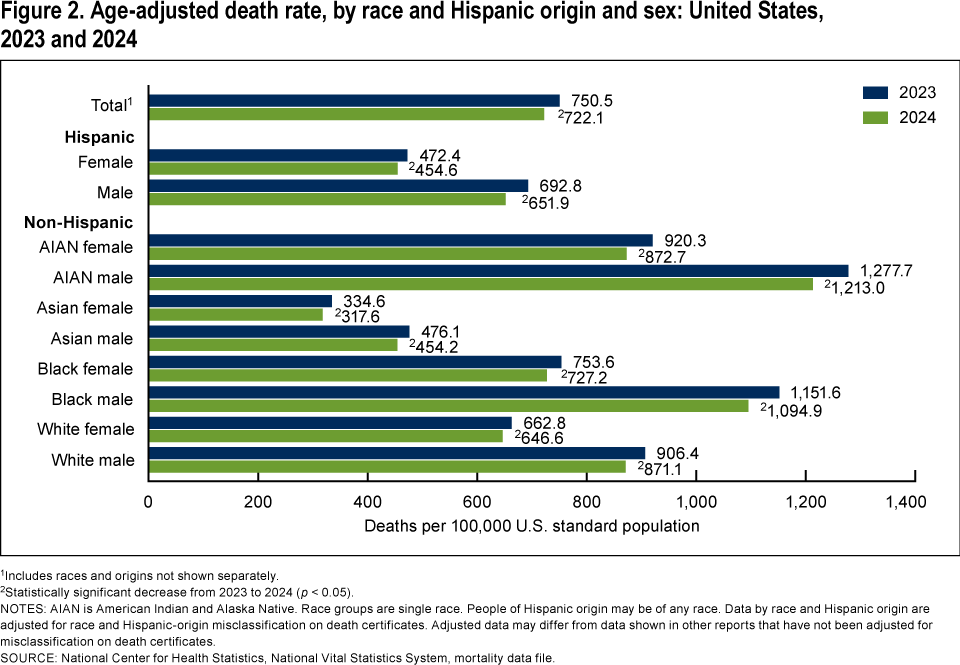
Uncertainty and Probability
Is observing 3 deaths "weird" if we expect 4.9? We can use a Poisson Distribution to determine the probability.
# Conceptual Poisson Calculation
import scipy.stats as stats

expected_mu = 4.9
observed_k = 3
probability = stats.poisson.cdf(observed_k, expected_mu)
print(f"Probability of 3 or fewer deaths: {probability:.2%}")
# Output: ~27%
A 27% probability suggests that seeing 3 or fewer deaths is not statistically unusual. However, there is a high degree of "fuzziness" here because the sample size of deaths is so small. The relative uncertainty is:
The Final Verdict: Selection Bias
If we look at the entire history of Burning Man, the death rate is nearly zero. This is the true anomaly. Even after adjusting for age, we still expect ~4.9 deaths, yet we usually see none.
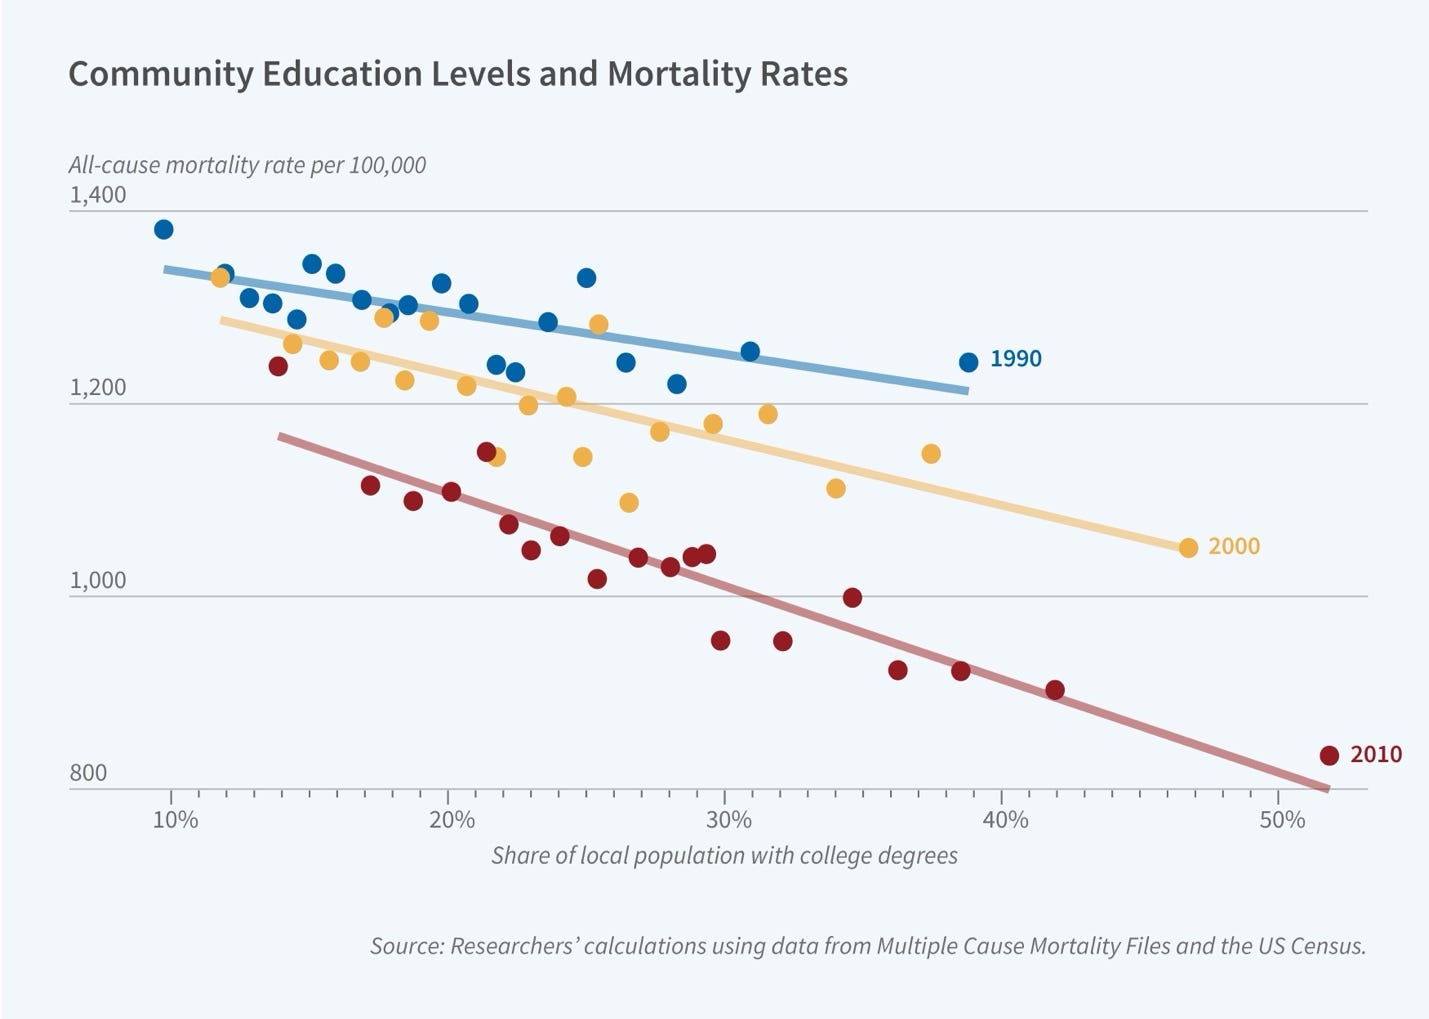
Would adjusting for race, income, or education close this gap?
- Age has a massive effect (logarithmic scale).
- Income/Race/Education have much smaller effect sizes.
The most likely explanation is Selection Bias. Burning Man doesn't just attract "young" people; it attracts people healthy enough to survive a week in a harsh desert environment.
Logic Flow: